


INTRODUCTION
Since the first report on intraoperative assessment of vascular flow using indocyanine green (ICG) video angiography (VA) by Raabe et al.,15) a number of articles describing its use in various fields of vascular surgery have been reported. However, most reported articles described qualitative analysis, and only a few articles have described quantitative analysis.1-2)14) Most of the studies reporting on quantitative analysis used specialized hardware or proprietary software, so that application of the described techniques to one's own study is not easy.
This study was conducted in order to perform quantitative analysis of ICG VA using standard hardware and easily-available software and to evaluate its clinical application.
MATERIALS AND METHODS
Retrospective analysis of intraoperative ICG VA, performed during aneurysm surgery from January 2010 to December 2010, was conducted. ICG VA was performed using a commercially available surgical microscope (OPMI® Pentero™, Carl Zeiss Co, Oberkochen, DE). After intravenous bolus injection of ICG (Daiichi Sankyo, Tokyo, JP), the field of interest was illuminated with near-infrared light. ICG, which had been stored at room temperature in a shaded area, was mixed with 10 ml of designated solvent just before injection. After confirmation of complete dissolution of ICG power in solvent, the mixed solution was infused through a central venous line, under the direction of an operator. Real-time angiographic image was seen on a video screen and recorded for further analysis. At each time, a standard dose of 25 mg dissolved in 5 ml of water was administered by an anesthesiologist under the order of the operating surgeon.
For quantitative analysis, the recorded video file was transformed to stack static images by the process of serial capture. It was performed using a GomPlayer (Ver. 2.1.36, Gretech Corp., Seoul, KR), which is free software, usually used for playing movie files, and is also able to capture static images serially from movie files with an interval from 0.01 to 120 seconds.
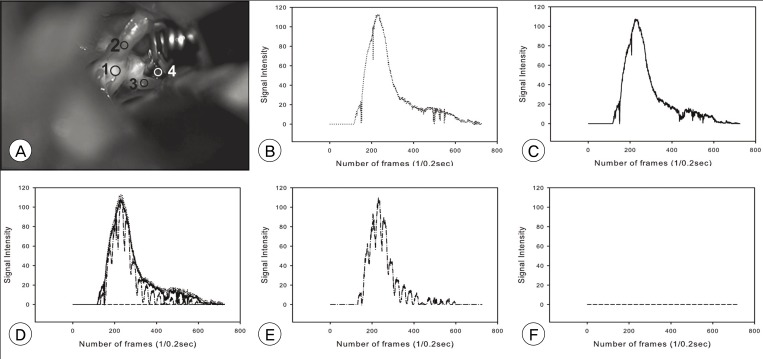
The image stack generated by capture software was fed into ImageJ (Ver. 1.42q, http://rsb.info.nih.gov/ij/, NIH, USA), using a multi-measure plug-in. The regions of interest (ROI) were selected for analysis, and the intensity changes of each ROI were then calculated by ImageJ as a spread sheet file. Selected ROIs were as follows: parent artery, distal branches to aneurysm, and dome of aneurysm. The ROI's were drawn in a circular shape to cover the vascular area on an averaged image. Averaged images were generated by the z-stack function of ImageJ. The spread sheet was used to make a graphic plot of changes in intensity of each ROI over time.
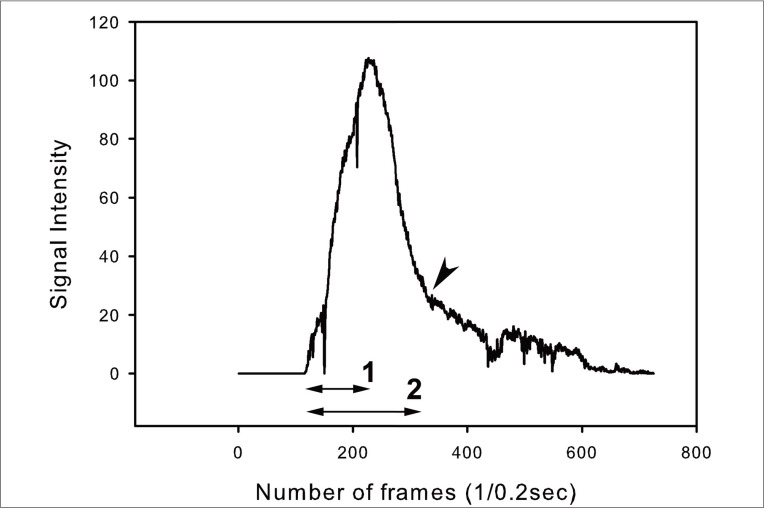
The graphs were reviewed and factors for achievement of better results were sought: the interval of serial capture, condition of recorded video. In addition, the time characteristics of graphs, time to peak, and washout time were also evaluated. Time to peak was defined as the interval from uprise of a wave to highest signal intensity of a wave, and washout time was defined as the interval from uprise of a wave to the time when rapid fall of signal intensity was changed to slow downfall. Statistical analysis was performed using SPSS (version 20, IBM SPSS Statistics, Armonk, NY).
RESULTS
Demographics
A total of 16 cases with ICG VA were analyzed. There were five cases of anterior communicating artery aneurysms and 11 cases of middle cerebral artery aneurysms (Table 1). There were seven males and nine females. The patients' ages were 54.5 ± 11.7 years (mean ± standard deviation, range 32 to 71).
Parameters for Analysis
In order to set up the best conditions for analysis, a graph was made with serial captures of 0.1, 0.2, and 0.4 second intervals. Routine evaluation found no definite differences in waves. However, using the magnified view, some loss of detail was observed in 0.4 second interval waves, compared to that of 0.1 and 0.2 second intervals (Fig. 1). Therefore, serial capture for analysis was performed using 0.2 second intervals.
The analysis was performed using a desktop personal computer without any delay in image processing and analysis. It runs under Windows XP professional (Korean version), equipped with AMD® Athlon™ CPU (64×2 Dual 5600+), 4GB RAM, NVIDIA® GeForce 8600GT™ graphic card.
Evaluation of the quality of data by superimposing image stacks was helpful. This process was performed using the z-project function of ImageJ. The averaged image showed no blurring when the video had been recorded without panning or zooming of the operative field and the graph showed good quality appropriate for analysis, whereas data with blurring of averaged image showed poor quality of graph (Fig. 2).
Evaluation of time profile
The time profile of each graph was assessed. Time to peak and washout time were measured from each graph (Fig. 3).
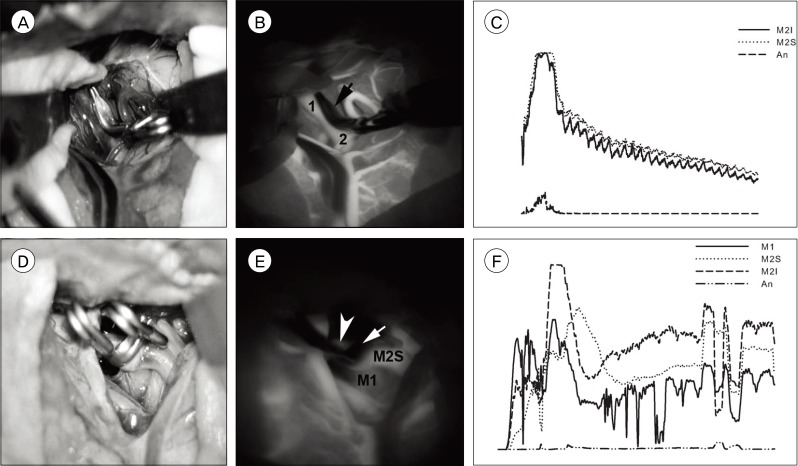
A summary of the measured time profile is shown in Table 1. In some cases, the wave was not suitable for assessment of time profile. The cause of unsuitable data was change of magnification (zooming) and moving of the operation field (panning) during ICG-VA recording, which precluded obtaining a static field for immobile ROIs. It was denoted as uncheckable. No definite difference in time profile was observed between proximal and distal vessels in valid cases (Fig. 4). There was no significant signal intensity of aneurysm dome in our series.
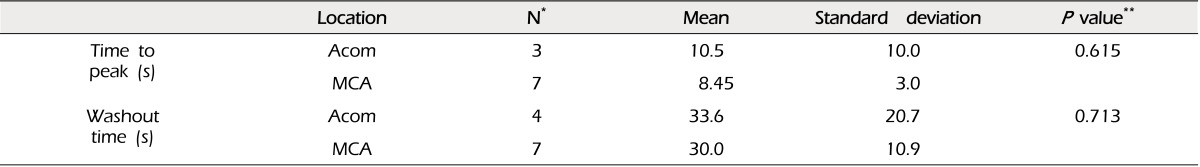
The time to peak was 9.0 ± 5.4 (mean ± standard deviation), and washout time was 31.3 ± 14.3 seconds. No significant difference in time profile was observed between anterior communicating artery aneurysms and middle cerebral artery bifurcation aneurysms (Table 2).
DISCUSSION
ICG is a near-infrared (NIR) fluorescent tricarbocyanine dye approved by the US Food & Drug Administration in 1956 for evaluation of cardiovascular and liver function; and for ophthalmic angiography, in 1975.5)15) After intravenous injection, it binds almost completely to globulin, so that the dye remains intravascular with a normal vascular permeability. Because it is rapidly eliminated exclusively by the liver (half-life, 2.4 minutes), repeated injections of ICG are possible.3)
ICG VA is based on the fluorescence of ICG. In plasma, it displays an absorption maximum at 805 nm and an emission maximum at 830 nm.3) Adverse reactions related to its clinical use are rare, and side effects, other than iodine allergy, have not been reported.3)9) A dose of 0.2 to 0.5 mg/kg is recommended for ICG-VA, with a maximum daily dose limit of 5 mg/kg.4)18)
Since the report on intraoperative flow assessment during cerebrovascular surgery by Raabe et al., a number of studies using ICG VA in various fields of neurosurgery, such as arteriovenous malformation (AVM), dural arteriovenous fistula (AVF), carotid endarterectomy (CEA), and extracranial-intracranial arterial bypass (EIAB), in addition to aneurysms, have been reported.1-2)8)10-11)16-17) These studies reported that ICG-VA was very useful for assessment of parent artery patency, detection of aneurysm dome filling, assessment of the completeness of the removal of the AVM nidus, localization and confirmation of complete AVF obliteration, and determining the residual stenosis in CEA.
Most articles reporting on ICG-VA in cerebrovascular surgery were based on qualitative analysis, in which the angiograms were evaluated with the naked eye without any quantitative base. Although a few articles in the field of cerebrovascular surgery describing quantitative analysis have been reported, several studies in other fields of surgery based on quantitative analysis and the usefulness of quantitative analysis have been reported.1-2)6)12-14) These studies reported on the usefulness of quantitative analysis of ICG-VA in prediction of survival of flaps and evaluation of change in cardiac muscle perfusion area according to progression of vascular compromise.6)12-13)
Quantitative analysis has several merits. It can differentiate residual ICG signal in the dome of an aneurysm from real re-filling of ICG by evaluating changes of signal intensities over time. It also is helpful in detection of vascular compromise according to difference in time profile between vessels.14) Difference in time profile between vessels is helpful for identification of feeding artery, draining vein, and normal cortical vein in AVM resection.2)
All of the reported articles describing quantitative analysis used specialized hardware or proprietary software, preventing other researchers from performing analysis on their own data. This study demonstrated the feasibility of quantitative analysis using conventional hardware and software. GomPlayer, free software popular in Korea, was used for serial capture of ICG-VA. However, any software capable of serial capture can be used instead. Measurement of serial ROI was performed using ImageJ, free software distributed by the National Institutes of Health (NIH). Any software can be used to make graphs presented in this article; for example, Microsoft Excel (Microsoft Corp., Seattle, WA).
Although ImageJ is capable of handling video file directly, its performance is often limited by various codec's used in video files. We think that it is more comfortable to use image stacks (set of serially captured images) rather than using the video file as it is. There might be a limitation to the number of images captures in some software; therefore, it would be better to perform serial capture using the longest interval possible. Increased number of serially captured images might also require more system resources. We found that a capture interval of 0.2 seconds per frame is sufficient for preservation of details in waves (Fig. 1).
The hardware specifications used for analysis in our study were of an intermediate level desktop computer purchased in 2008. Considering the rapid progress in computer technology, the analysis can be performed on almost any current desktop computer or notebook computer. Therefore, the technique described in this article is open to anyone who wishes to analyze the ICG-VA by himself.
One of the requirements for better analysis is the static field, which means no motion or change of magnification of the operative field during ICG-VA recording (Fig. 2). All of the data depicted as 'uncheckable' in Table 1 resulted from this unstatic field of view. The critical time profile, required for analysis, was displayed in 120 seconds (2 minutes) after the first appearance of fluorescence signal in arteries. Therefore, maintenance of a static field for 2 to 3 minutes is recommended as sufficient for acquiring an ICG-VA suitable for analysis. If the operator wants to see a higher magnification view or check the vascular patency at a different angle, it is better to wait for 2 to 3 minutes or redo the ICG-VA with a second shot of dye in case of need.
No significant difference in time profile was observed between proximal and distal branch vessels. Considering the proximity of points of measurement and velocity of arterial flow, this finding is thought to be not changed in larger series. A difference in time profile between vessels, although not depicted in our series, might suggest serious compromise in blood flow in that vessel. No definite difference of time profiles among vessels was reported in an EIAB series.1) No significant difference in time profile was observed between anterior communicating artery aneurysms and middle cerebral artery bifurcation aneurysms. This means that there is no definite difference in hemodynamics between cerebral arteries, although this finding might need to be verified with a larger series. Our data showed large variation in time to peak and washout time. Among the 16 cases in our series, there were six cases with poor quality data. Therefore, the actual number of cases used for analysis of time profile was approximately two thirds of the total cases. We think that the high variation might be a reflection of a small number of cases and due in part to the suboptimal quality of data.
Intraoperative microvascular Doppler sonography (mDs) is another adjunctive now frequently used for quality assessment in cerebrovascular surgery. mDS is easy to apply with instant results; however, because it only evaluates a pinpoint site, comparison of differences between points is difficult.12) ICG-VA is good for simultaneous evaluation of perfusion of areas with multiple points, however, it is not suitable for evaluation of blood flow of giant, complex, and deep-seated aneurysms.4) mDs and ICG-VA have been reported to complement one another, and combination of the two techniques assures the quality of aneurysm surgery.7)
Our data include several features. This study was conducted using conventional hardware and software for quantitative analysis. Any ICG-VA, recorded according to the guidelines described, can be used as source data for analysis, as described in the Materials and Methods section. It described the time profile of ICG-VA in aneurysm surgery, which might provide baseline data for future study with a larger series. Quantitative analysis can be performed approximately 5 minutes after recording of ICG-VA by anyone familiar with the technique. Therefore, it might be used to help surgeons in assessment of the completeness of surgery in semi-real time base, if the above-mentioned requirements for data suitable for analysis have been satisfied.
The time profiles presented in this study seem to be verified with those of larger series. Data elucidated by large series might be helpful for detection of minute derangements from normal value, and will make quantitative analysis more useful for improvement of surgical outcome of cerebrovascular surgeries. In addition, application of quantitative analysis of ICG-VA might be useful in various aspects of cerebrovascular surgery other than aneurysms.
CONCLUSION
Quantitative analysis of ICG-VA is feasible using a personal computer and common video capture and analysis software. It displays time profiles of multiple points of interest over time, helps in objective evaluation of changes of blood flow over time, and it might be helpful in various fields of cerebrovascular surgery.


 PDF Links
 PubReader
 Full text via DOI
 Full text via PMC
 Download Citation
 Print
Print