


INTRODUCTION
Acute ischemic stroke is an event of the highest urgency. Persistent major cerebral arterial occlusion is associated with high mortality and poor neurologic outcome.6)20) Recanalization using intravenous administration of tissue plasminogen activator (IV-tPA) or intra-arterial chemical thrombolysis (IAT) has been shown to improve patient outcome.2)7)22) Endovascular mechanical thrombectomy (MT) has recently been shown to induce high-grade, rapid recanalization, resulting in favorable clinical outcomes.8)9)16)
To date, several studies have reported on the usefulness of assessment of thrombus burden using computed tomography (CT) angiography in prediction of clinical and radiologic outcomes.1)11)21) In addition, a small number of studies using magnetic resonance image (MRI) for estimation of treatment outcomes and thrombus burdens have been reported. Cho et al. suggested that the magnetic susceptibility effect of deoxyhemoglobin in intraluminal clots, which appears as a hypointense signal on T2*-weighted gradient echo (GRE) images, might predict cardioembolic stroke and subsequent recanalization. These authors termed this radiologic finding the "GRE susceptibility vessel sign (GRE SVS)".4) However, Schellinger et al. reported that the GRE SVS can aid in diagnosis of ischemic disease but does not predict recanalization.19) Previous studies have focused solely on the presence of GRE SVS and recanalization after thrombolytic treatment. Correlations between thrombus size according to GRE SVS and recanalization after IV-tPA have not been thoroughly investigated.
The current study was conducted for analysis of the relationships between thrombus size of GRE SVS and recanalization after thrombolytic therapy using IV-tPA.
MATERIALS AND METHODS
Patient selection
Between October 2005 and August 2013, 408 patients with acute ischemic stroke including the middle cerebral artery territory were treated with thrombolytic therapy using IV-tPA (IV-tPA was performed within 3 hours of symptom onset). Clot location can affect clot dissolution, and internal carotid artery (ICA) terminus occlusions are the least likely to be recanalized with IV-tPA.12)18) Thus, in order to minimize the influence of clot location, ICA terminus occlusions were excluded, and the author limited the inclusion criteria such that only M1 occlusion patients were included in this study. The author performed a retrospective analysis of the clinical (underlying disease and National Institutes of Health Stroke Scale (NIHSS)) and imaging (initial and follow up MRI, or cerebral angiography) data of 55 patients who showed GRE SVS on their initial MRI.
Treatment algorithm and assessment
On admission, neurologic assessments based on the NIHSS were performed by a stroke neurologist. All patients underwent a multimodal MRI prior to thrombolytic therapy, within 20 minutes of admission. The multimodal MRI protocol included diffusion-weighted imaging (DWI), GRE, a fluid attenuated inversion recovery sequence, 3D time-of-flight MR angiography (MRA), and perfusion-weighted imaging (PWI). Follow up MRIs were performed within 24 hours of thrombolytic therapy. Subsequent transfemoral cerebral angiography (TFCA) was considered for patients who failed to exhibit neurologic improvement within 1 hour of IV-tPA. IV-tPA (0.9 mg/kg) was infused over 60 minutes, and 10% of the total dose was administered in an initial bolus over 1 minute.
Image analysis
GRE SVS was defined by hypointense signals in the cerebral artery in axial section T2*-weighted gradient echo images of the territory that corresponded to high signal on the DWIs. MRI examinations were performed on a 1.5 T unit. The common MRI parameters for DWI and GRE were an equivalent slice thickness of 5 mm, an interslice gap of 2 mm, 20 axial slices, and field-of-view of 220 × 220. DWI parameters included a repetition time (TR) of 3000 ms, an echo time (TE) of 73.5 ms, and a matrix number of 160 × 160. GRE parameters were TR of 550 ms, a TE of 20 ms, a matrix number of 256 × 192, and a flip angle of 20°. MRA parameters included a flip angle of 20°, a matrix number of 256 × 192, a field-of-view of 210 × 210, TR of 25 ms, and TE of 6.3 ms.
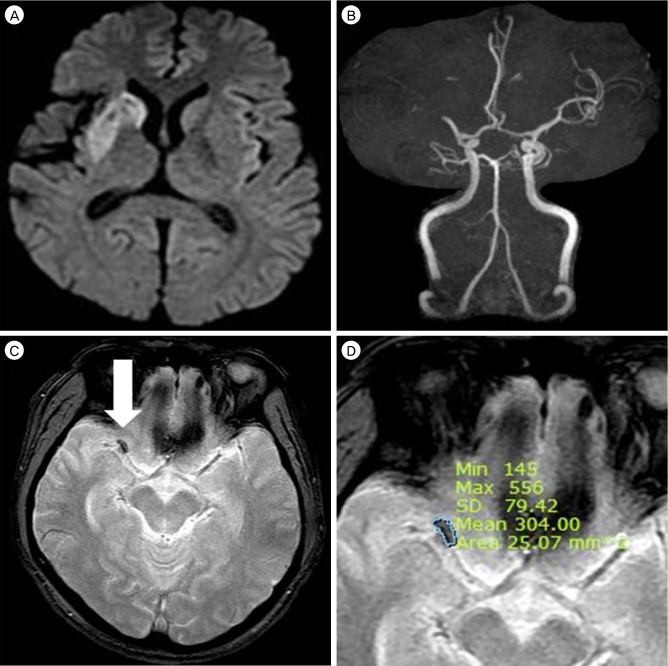
For estimation of thrombus size, which can represent the actual thrombus volume, the cross-sectional areas of the GRE SVSs on the initial MRI were calculated. The approximate volume of the mass on MRI can be expressed as summation of the products of cross-sectional areas and slice thickness. The average diameter of M1 is 3.35 mm.14) Therefore, GRE SVSs on M1 usually appeared in a slice, and we calculated thrombus cross-sectional area as a representative value of thrombus volume. Radiographic estimations of the cross-sectional areas of the thrombi based on the GRE SVSs were performed using the Picture Archiving and Communication System (PACS; Maroview version 5.4, MAROTECH Inc., Seoul, Korea) and a region of interest (ROI) calculator (Fig. 1). When the GRE SVSs appeared in two slices due to curvature of MCA, the areas were summed.
Recanalization was defined as the reappearance of the distal part of the occluded vessel on the follow-up MRI. In following TFCA, recanalization was graded according to Thrombolysis in Cerebral Infarction (TICI) scores (Grade 0: no perfusion; Grade 1: penetration with minimal perfusion; Grade 2a: partial filling (< 2/3) of the vascular territory; Grade 2b: complete filling of the vascular territory that occurs more slowly than normal; and Grade 3: complete perfusion).10) TICI grades of 2b and 3 were considered to indicate successful recanalization.
Statistical analyses
Chi-square tests were used to examine factors that may have affected recanalization. Independent samples t-tests were performed for comparison of average values. Median tests were used for comparison of NIHSS scores. For estimation of the diagnostic value of thrombus size in terms of recanalization after IV-tPA, a receiver operator characteristic (ROC) curve test was performed, and the cut-off value that maximized the sensitivity and specificity was calculated. Binary logistic regression analysis was performed using SPSS 12.0 (SPSS INC., Chicago, IL, USA) for estimation of the independent contributions of the variables. Statistical analyses were performed using SAS version 9.2 (SAS Institute, Cary, NC, USA), with the exception of the logistic regression, which was performed using SPSS 12.0 for Windows. All p values below 0.05 were considered statistically significant.
RESULTS
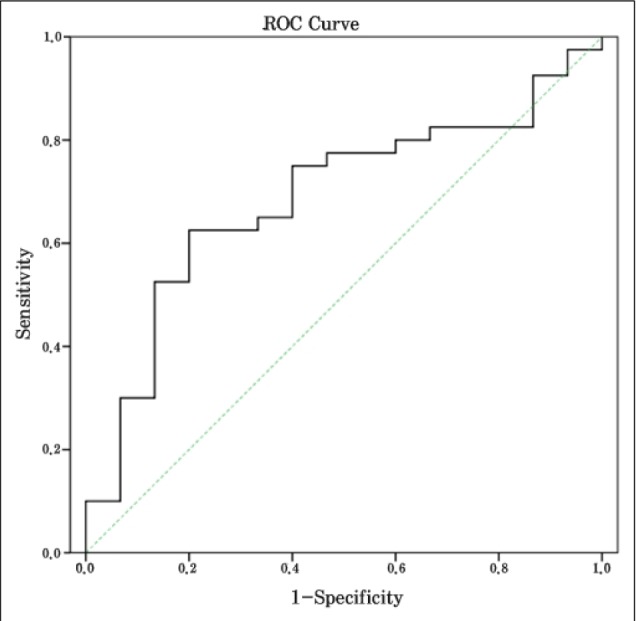
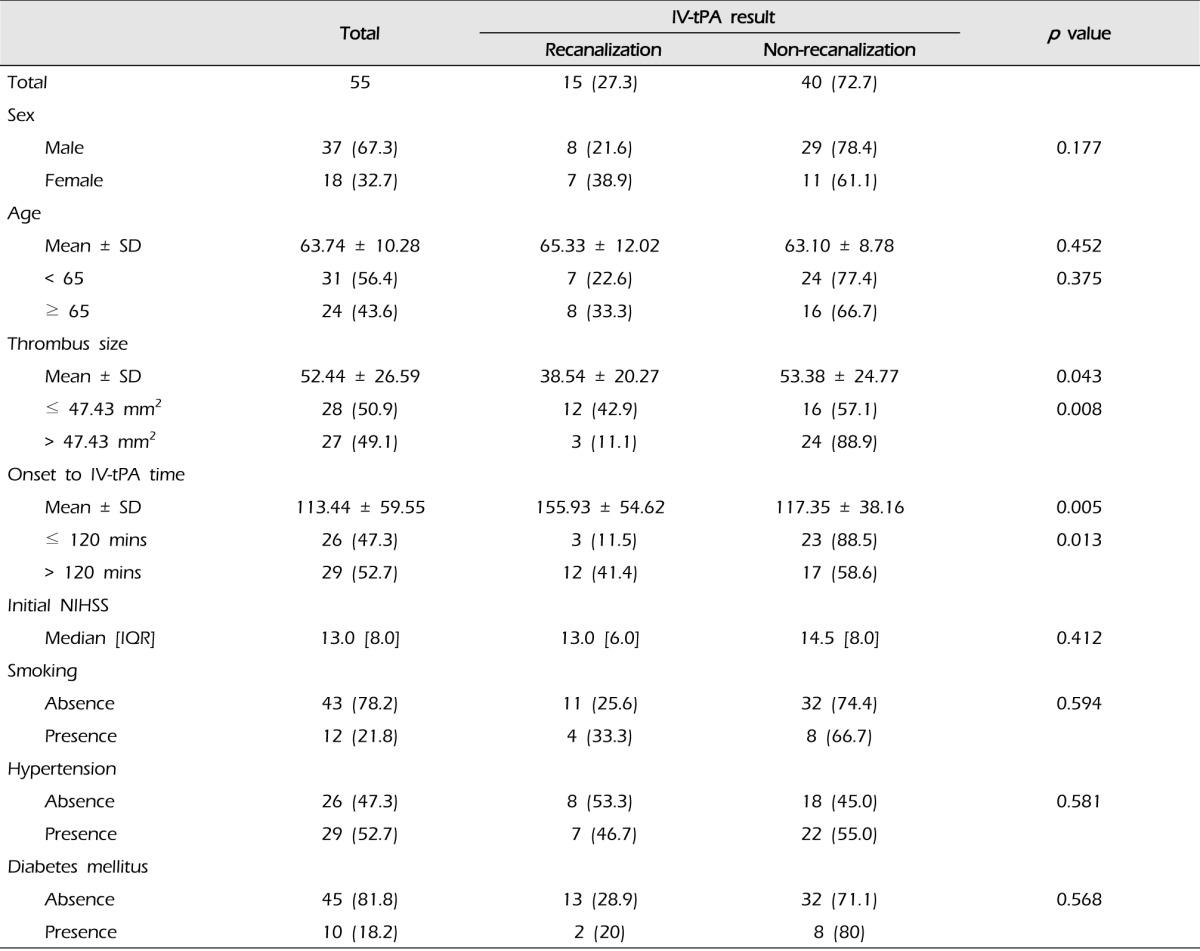
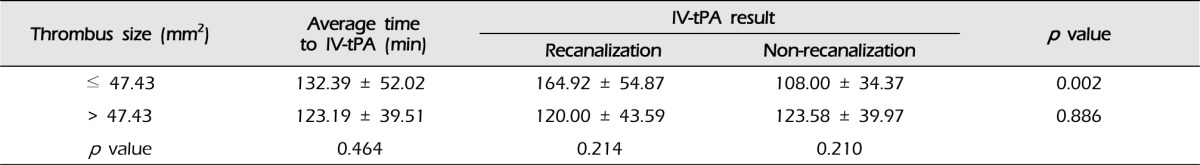
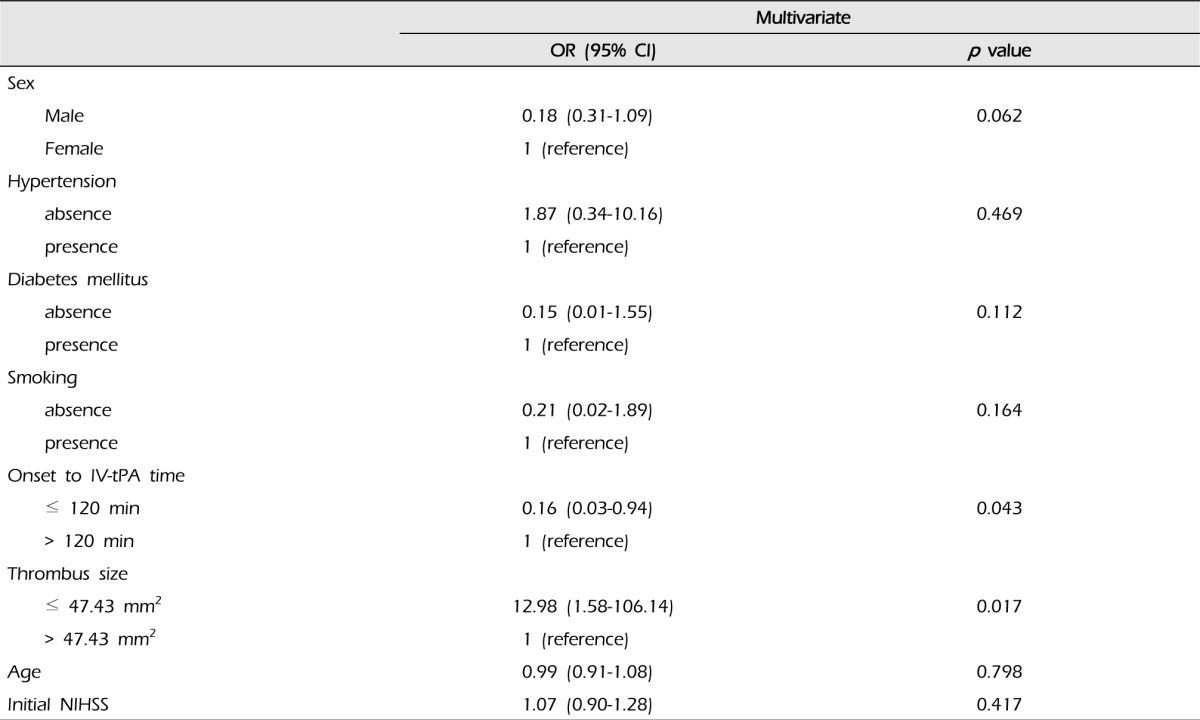
Our patient pool consisted of 55 patients (37 males and 18 females) with an average age of 63.74 ± 10.28 years (range: 43-77 years). The median NIHSS score was 13. Fifteen patients (27.3%) achieved recanalization after IV-tPA, and the average thrombus size of the recanalization group was 38.54 ± 20.27 (12.62-91.40) mm2. The average thrombus size of the non-recanalization group was 53.38 ± 24.77 (9.97-95.64) mm2 (p = 0.043). In addition, patients with small thrombi (≤ 47.43 mm2; i.e., the median value of this data) were more likely to achieve recanalization than patients with large thrombi (> 47.43 mm2) (p = 0.008). The times between symptom onset and IV-tPA were 155.93 ± 54.62 and 117.35 ± 38.16 minutes for the recanalization group and the non-recanalization group, respectively (p = 0.005). Patients with longer IV-tPA onset times (> 120 mins) were more likely to achieve recanalization (p = 0.013) (Table 1). In addition, among patients with small thrombi (≤ 47.43 mm2), the IV-tPA onset time of the recanalization group was longer than that of the non-recanalization group (Table 2). Results of multivariate analysis showed an association of thrombus size (p = 0.017) and IV-tPA onset time (p = 0.043) with recanalization and thrombi sizes smaller than 47.43 mm2 and IV-tPA onset times over 120 minutes were associated with increased odds ratios (Table 3). Fig. 2 illustrates the ROC curve for thrombus cross-sectional area in relation to recanalization. The thrombus size of the cut-off point was 47.28 mm2, which was similar to the median thrombus size. The sensitivity at this cut-off point was 73.3%, the specificity was 60%, and the area under the curve was 0.687. This cut-off point may be relatively valuable in predicting recanalization after IV-tPA. No differences in initial NIHSS scores, diabetes mellitus (DM), hypertension (HTN), or smoking were observed between the recanalization and non-recanalization groups.
DISCUSSION
After intracranial hemorrhage, oxyhemoglobin in the blood is transformed into deoxyhemoglobin, followed by methemoglobin, and finally hemosiderin. Deoxyhemoglobin, methemoglobin, and hemosiderin have paramagnetic effects that cause hypointense signals on MRI, particularly on GRE.12)15) Intraluminal clots proceed through a sequential degradation similar to that observed after intracranial hemorrhage. Thus, thrombi in occluded vessels appear as hypointense signals on GRE. GRE SVSs might predict cardioembolic stroke and may be associated with subsequent recanalization due to the high binding affinity of tPA for fibrin, which is enriched in the red thrombi that compose cardiac emboli.4) Some previous studies have shown that thrombus burden on CT can be a useful diagnostic tool for prediction of clinical and radiological outcome.1)11)21) There are some reports on SVS and thrombus burden on CT. Sakamoto et al. reported that SVS and hyperdense MCA sign may represent the same thrombus.17) Legrand et al., who adapted the CT angiography-based Clot Burden Score (CBS) to T2*-MRI, reported an association of high clot burden with lower 24-hour recanalization rate. The CBS, a scoring system for defining the extent of thrombus, is a semi-quantitative score.13) In the current study, the author attempts to quantify the thrombus burden.
The current study was conducted for examination of thrombus size according to GRE SVS and recanalization after IV-tPA. In this study of thrombus size and recanalization after IV-tPA, thrombus size on GRE SVS was found to shown an association with recanalization (p = 0.017). Patients with acute M1 occlusions and small thrombi size were more likely to achieve recanalization after IV-tPA. Thus, neurointerventions that immediately follow IV-tPA are recommended for acute ischemic stroke patients with large GRE SVS.
A previous study reported a higher recanalization rate and more favorable functional outcomes for patients who underwent IV-tPA prior to MT than for those who underwent MT without IV-tPA.5) Use of IV-tPA may improve the recanalization rate of MT even if immediate recanalization fails. Another recent study reported that MT is effective in acute ischemic stroke without GRE SVS.3) Thus, if a patient has a large thrombus based on GRE SVS or has MCA stenosis and thrombotic occlusion without GRE SVS, immediately following IV-tPA with MT may be a useful strategy for treatment of M1 total occlusion.
Among patients who underwent IV-tPA and had small thrombi (≤ 47.43 mm2), the treatment onset time was longer among patients who achieve recanalization compared with those who did not achieve recanalization (Table 2). Thus, the recanalizing group experienced longer IV-tPA onset times than the non-recanalizing group (Table 1). These finding can be interpreted according to thrombus size and severity of symptoms. We speculated that acute ischemic stroke patients with small thrombi might have milder symptoms than patients with large thrombi and thus could take longer time to visit the hospital. However, the location of occlusion and the existence of collateral flow might influence the severity of the initial symptoms; therefore, a larger scale study with more variables may be needed in order to reach statistical significance.
Based on results shown in Tables 2 and 3, it is likely that thrombus size has a greater influence on recanalization than time to IV-tPA treatment dose.
The current study had several limitations. First, the spatial extents of GRE SVSs are not well defined, and this lack of definition has been referred to as a "blooming effect".23) Due to this effect, the thrombus areas on GRE appear larger than the actual thrombi, and GRE SVS might not be indicative of the true thrombus burden. However, in this study, all patients visited the hospital within 3 hours of stroke; thus, the intraluminal clots were examined after limited amounts of time had passed, and these clots had undergone similar levels of deoxygenation. Thus, these intraluminal clots had similar paramagnetic effects, and the thrombus sizes of each case were somewhat accurate indicators of clot burden. In addition, correlations were found between GRE SVS size and recanalization after IV-tPA. The author suggests that thrombus size on GRE can be easily measured and that the relative size of the thrombus is a useful diagnostic tool. Second, in this study, the MRI slice thickness was 5 mm. If thinner slices are acquired, the approach of summing the cross-sectional areas should be adopted in order to approximate clot volume. Finally, the patient population enrolled in this study was relatively small; thus, more cases are needed. The authors analyzed the correlation between thrombus sizes, as estimated based on GRE SVS and recanalization after treatment and sought to quantify the clot burden. The authors expect that this result may improve decision-making in management of ischemic stroke.
CONCLUSION
The authors found a correlation between thrombus size on GRE and radiologic outcome after IV-tPA. Thrombus size on GRE may be a relative predictor of radiologic outcome. M1 occlusions with small thrombi according to GER SVS were more likely to be recanalized following thrombolysis with IV-tPA. Thrombus size on GRE is a simple diagnostic tool that can be easily measured, for quantitative assessment of clot burden in acute M1 occlusion. It can also be helpful in decision making with regard to use of more aggressive recanalization strategies.
 PDF Links
 PubReader
 Full text via DOI
 Full text via PMC
 Download Citation
 Print
Print